- Download AviDeepChartJs file from below link.
- Open this file into notepad++
- Save as type Javascript file at another location.
- Upload this file into Salesforce static resource.

5. Create Apex Class
public class ad_Opp_Controller {
@AuraEnabled(cacheable=true)
public static List<Opportunity> getOpportunityList()
{
return [Select Id, StageName from Opportunity];
}
}
6. Create LWC Component (ad_RootChart) and copy paste below code into html and Js
———————–
ad_RootChart.html
———————–
<template>
<div class=”slds-grid slds-grid–align-center” style=”background: white; margin:2px;border:1px dotted #DDDDDD;”>
<canvas lwc:dom=”manual” height=”150px” width=”200px”></canvas>
</div>
</template>
————————
ad_RootChart.Js
————————
import { LightningElement, track,api } from “lwc”;
import chartjs from “@salesforce/resourceUrl/AviDeepChart”;
import { loadScript } from “lightning/platformResourceLoader”;
import { ShowToastEvent } from “lightning/platformShowToastEvent”;
export default class Sh_FIM_PermissionSetChart extends LightningElement {
@api chartDataset;
chart;
renderedCallback() {
Promise.all([loadScript(this, chartjs)])
.then(() => {
const ctx = this.template.querySelector(“canvas”);
this.chart = new window.Chart(ctx, JSON.parse(JSON.stringify(this.chartDataset)));
})
.catch(error => {
this.dispatchEvent(
new ShowToastEvent({
title: ‘Error loading Chart’,
message: error.message,
variant: ‘error’,
})
);
});
}
}
———————————-
ad_RootChart.js-meta.xml
———————————-
<?xml version=”1.0″?>
<LightningComponentBundle xmlns=”http://soap.sforce.com/2006/04/metadata”>
<apiVersion>57.0</apiVersion>
<isExposed>true</isExposed>
<targets>
<target>lightning__AppPage</target>
<target>lightning__HomePage</target>
<target>lightning__Tab</target>
</targets>
</LightningComponentBundle>
6. Create LWC Component (ad_OppDashboard) and copy paste below code into html and Js
—————————–
ad_OppDashboard.html
—————————–
<template>
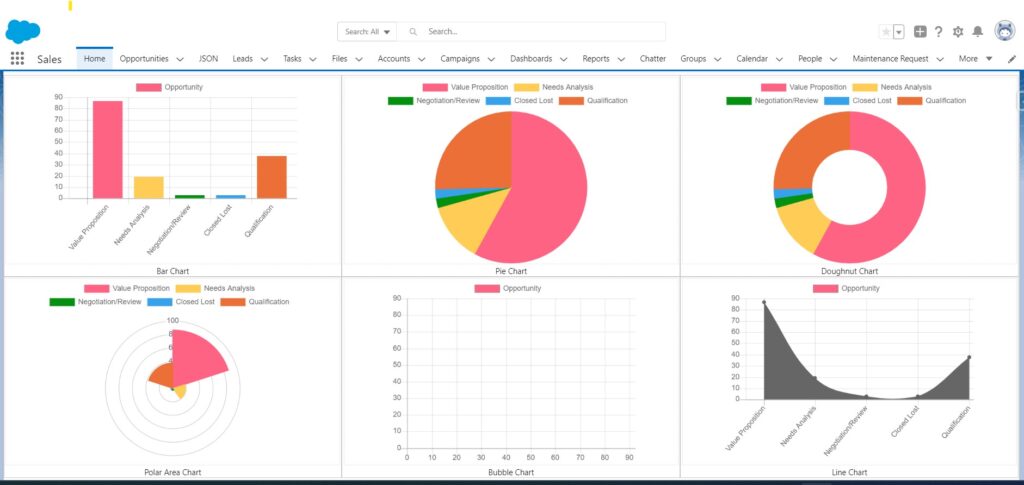
<lightning-card class=”slds-size_1-of-2″ title=”Opportunity Stage Wise View”>
<lightning-layout>
<lightning-layout-item size=”12″ data-item=”inlineblock”>
<div>
<div class=”slds-grid slds-wrap”>
<div class=”slds-col slds-size_1-of-3″ style=”border:1px solid #cacaca;” if:true={oppBarconfig}>
<c-ad_-root-chart chart-dataset={oppBarconfig}>
</c-ad_-root-chart>
<div style=”display: flex; justify-content: center;”>Bar Chart</div>
</div>
<div class=”slds-col slds-size_1-of-3″ style=”border:1px solid #cacaca;” if:true={oppPieconfig}>
<c-ad_-root-chart chart-dataset={oppPieconfig}>
</c-ad_-root-chart>
<div style=”display: flex; justify-content: center;”>Pie Chart</div>
</div>
<div class=”slds-col slds-size_1-of-3″ style=”border:1px solid #cacaca;” if:true={oppDoughnutConfig}>
<c-ad_-root-chart chart-dataset={oppDoughnutConfig}>
</c-ad_-root-chart>
<div style=”display: flex; justify-content: center;”>Doughnut Chart
</div>
</div>
<div class=”slds-col slds-size_1-of-3″ style=”border:1px solid #cacaca;” if:true={oppPolarAreaConfig}>
<c-ad_-root-chart chart-dataset={oppPolarAreaConfig}>
</c-ad_-root-chart>
<div style=”display: flex; justify-content: center;”>Polar Area Chart
</div>
</div>
<div class=”slds-col slds-size_1-of-3″ style=”border:1px solid #cacaca;” if:true={oppBubbleConfig}>
<c-ad_-root-chart chart-dataset={oppBubbleConfig}>
</c-ad_-root-chart>
<div style=”display: flex; justify-content: center;”>Bubble Chart
</div>
</div>
<div class=”slds-col slds-size_1-of-3″ style=”border:1px solid #cacaca;” if:true={oppLineConfig}>
<c-ad_-root-chart chart-dataset={oppLineConfig}>
</c-ad_-root-chart>
<div style=”display: flex; justify-content: center;”>Line Chart
</div>
</div>
</div>
</div>
</lightning-layout-item>
</lightning-layout>
</lightning-card>
</template>
—————————
ad_OppDashboard.js
—————————
import { LightningElement , track, api, wire} from ‘lwc’;
import getOpportunityList from ‘@salesforce/apex/ad_Opp_Controller.getOpportunityList’;
export default class Ad_OppDashboard extends LightningElement {
oppBarconfig;
oppPieconfig;
oppDoughnutConfig;
oppPolarAreaConfig;
oppBubbleConfig;
oppLineConfig;
mapChartBackgroundColor = new Map();
connectedCallback() {
this.mapChartBackgroundColor.set(0, ‘rgb(255, 99, 132)’);//red
this.mapChartBackgroundColor.set(1, ‘rgb(255, 205, 86)’);//yellow
this.mapChartBackgroundColor.set(2, ‘rgb(3, 145, 15)’);//green
this.mapChartBackgroundColor.set(3, ‘rgb(54, 162, 235)’);//blue
this.mapChartBackgroundColor.set(4, ‘rgb(235, 111, 54)’);//orange
this.mapChartBackgroundColor.set(5, ‘rgb(75, 192, 192)’);//lightgreen
this.mapChartBackgroundColor.set(6, ‘rgb(163, 75, 192)’);//purple
}
@wire(getOpportunityList)
wiredOpprtunityList({ error, data }) {
if(data)
{
let listOfOppStatus = [];
let listOfOppStatusDataCount = [];
let listOfBackgroundColor = [];
let mapOppData = new Map();
for (let i = 0; i < data.length; i++) {
if (!mapOppData.has(data[i].StageName)) {
mapOppData.set(data[i].StageName, 1);
}
else {
mapOppData.set(data[i].StageName, mapOppData.get(data[i].StageName) + 1);
}
}
let m = 0;
let bgColor = this.mapChartBackgroundColor;
mapOppData.forEach(function (value, key, map) {
console.log(‘Key -> ‘ + key + ‘ value -> ‘ + value);
listOfOppStatus.push(key);
listOfOppStatusDataCount.push(mapOppData.get(key));
listOfBackgroundColor.push(bgColor.get(m));
m++;
});
if (listOfOppStatusDataCount.length > 0) {
this.oppBarconfig = {
type: “bar”,
data: {
labels: listOfOppStatus,
datasets: [{
label: ‘Opportunity’,
data: listOfOppStatusDataCount,
backgroundColor: listOfBackgroundColor,
borderColor: listOfBackgroundColor,
borderWidth: 1
}]
},
options: {
scales: {
y: {
beginAtZero: true
}
}
},
};
this.oppPieconfig = {
type: “pie”,
data: {
labels: listOfOppStatus,
datasets: [{
label: ‘Opportunity’,
data: listOfOppStatusDataCount,
backgroundColor: listOfBackgroundColor,
borderColor: listOfBackgroundColor,
borderWidth: 1
}]
},
options: {
scales: {
y: {
beginAtZero: true
}
}
},
};
this.oppDoughnutConfig = {
type: “doughnut”,
data: {
labels: listOfOppStatus,
datasets: [{
label: ‘Opportunity’,
data: listOfOppStatusDataCount,
backgroundColor: listOfBackgroundColor,
borderColor: listOfBackgroundColor,
borderWidth: 1
}]
},
options: {
scales: {
y: {
beginAtZero: true
}
}
},
};
this.oppPolarAreaConfig = {
type: “polarArea”,
data: {
labels: listOfOppStatus,
datasets: [{
label: ‘Opportunity’,
data: listOfOppStatusDataCount,
backgroundColor: listOfBackgroundColor,
borderColor: listOfBackgroundColor,
borderWidth: 1
}]
},
options: {
scales: {
y: {
beginAtZero: true
}
}
},
};
this.oppBubbleConfig = {
type: “bubble”,
data: {
labels: listOfOppStatus,
datasets: [{
label: ‘Opportunity’,
data: listOfOppStatusDataCount,
backgroundColor: listOfBackgroundColor,
borderColor: listOfBackgroundColor,
borderWidth: 1
}]
},
options: {
scales: {
y: {
beginAtZero: true
}
}
},
};
this.oppLineConfig = {
type: “line”,
data: {
labels: listOfOppStatus,
datasets: [{
label: ‘Opportunity’,
data: listOfOppStatusDataCount,
backgroundColor: listOfBackgroundColor,
borderColor: listOfBackgroundColor,
borderWidth: 1
}]
},
options: {
scales: {
y: {
beginAtZero: true
}
}
},
};
}
}
else if (error) {
console.log(error);
}
}
}
———————————–
ad_OppDashboard.js-meta.xml
———————————–
<?xml version=”1.0″?>
<LightningComponentBundle xmlns=”http://soap.sforce.com/2006/04/metadata”>
<apiVersion>57.0</apiVersion>
<isExposed>true</isExposed>
<targets>
<target>lightning__AppPage</target>
<target>lightning__HomePage</target>
<target>lightning__Tab</target>
</targets>
</LightningComponentBundle>
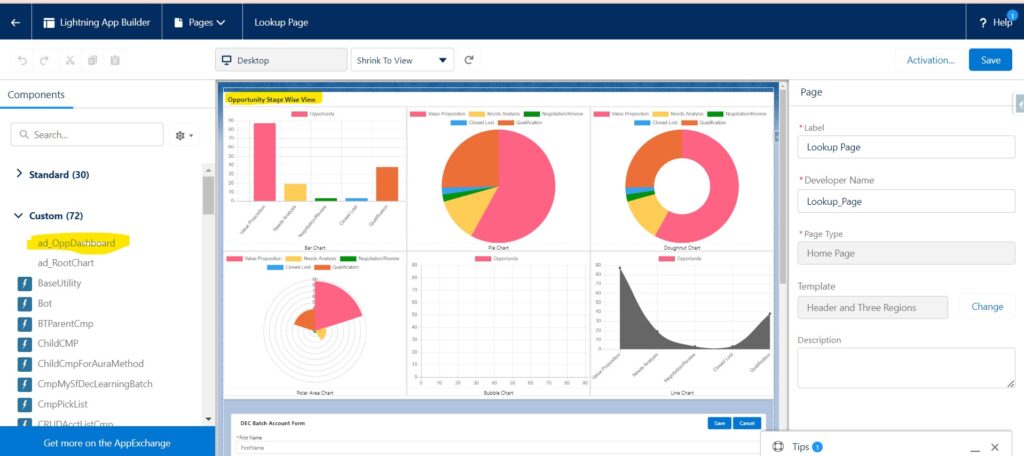
7. Drag and Drop your LWC Component(ad_OppDashboard) on Sales App Home Page and Click on Save.

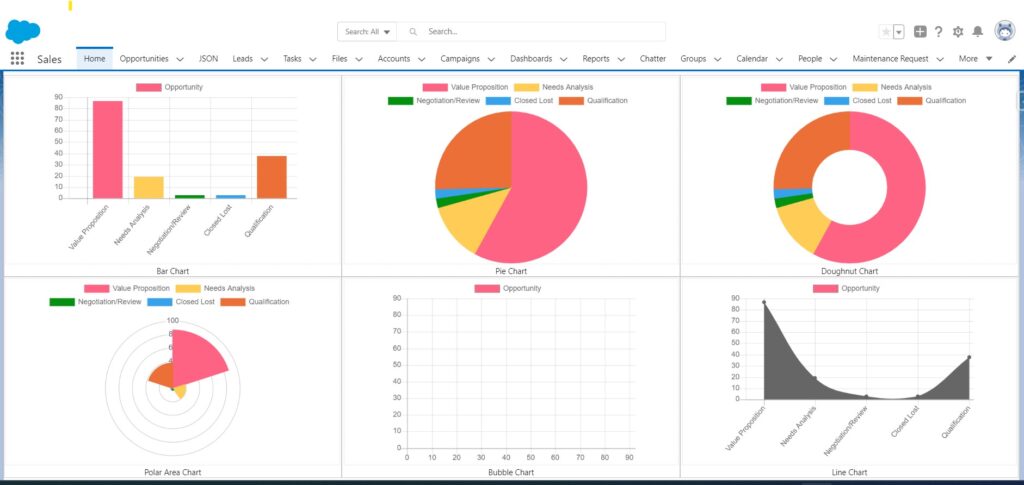
8. Goto App -> Sales -> Click on Home tab. You Can see Chart of Opportunity Stage popup on Home page as below.

